Almost anyone who has been around a Windows system has seen the dreaded BSOD.
It’s a puzzling display of hex-code, and techno-babble that will often cause the sweetest tea-sipping granny to curse the Viking god of war and send him running for cover.
Even many geeks would rather just offer up a “looks like you need to wipe it and reload the system” with a shrug than to try to pick apart the Rosetta Stone of words and code offered.
Sure, with patience and some basic understanding, one can copy down (or pull from a crash dump log) the error, do some Google work, and often find a solution. But come on, how many mere mortals would do that?
Brilliant freeware utility programmer Nir Sofer has just made this process much more delicate and refined. How easy to get to the bottom of a BSOD you ask? Well, so easy a caveman can…oh…well, you’ve seen the commercials by now.
- BlueScreenView - View blue screen of death (STOP error) information – freeware utility – NirSoft.
BlueScreenView requires no “installation” thus is portable between systems, and it works with Windows XP, Windows Server 2003, Windows Server 2008, Windows Vista, and Windows 7, “…as long as Windows is configured to save minidump files during BSOD crashes.” Per Mr. Sofer.
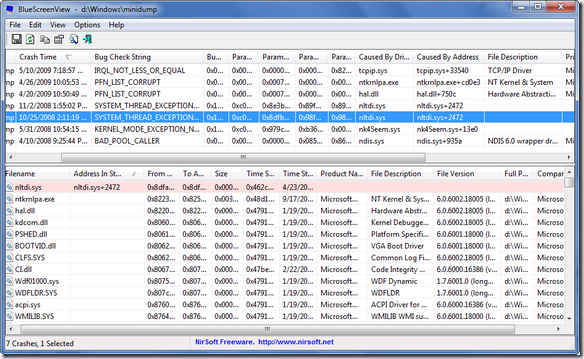
Above: Dump display of a particular crash on my Vista system (BSOD XP Style display in lower pane).
Above: Dump display showing suspected driver causing crash in detail view in lower pane.
BlueScreenView features as described by Nir on the product page are…
- Automatically scans your current minidump folder and displays the list of all crash dumps, including crash dump date/time and crash details.
- Allows you to view a blue screen which is very similar to the one that Windows displayed during the crash.
- BlueScreenView enumerates the memory addresses inside the stack of the crash, and find all drivers/modules that might be involved in the crash.
- BlueScreenView also allows you to work with another instance of Windows, simply by choosing the right minidump folder (In Advanced Options).
- BlueScreenView automatically locate the drivers appeared in the crash dump, and extract their version resource information, including product name, file version, company, and file description.
That 4th one there is really cool. I actually was running the tool on my VHD booted Win7 system (x64 bit). Unfortunately, the tool doesn’t currently support x64 bit system dumps, but I simply pointed it to the minidump folder on my Vista system (showing in the program’s title bar as on the D: drive (really the C: but as I’m VHD booting, it becomes the "D:”) and it was able to pull up the records just fine.
That’s very important if, say the system does a hard-crash, and you can’t get it up. Or maybe the system crashed and your significant-other/customer didn’t bother to leave any notes for you and just reset the system leaving you nothing but a scowl and smorgasbord of “it BSOD, Fix it!” on the table before you.
Now you can maybe boot the system with a Win PE disk, with this app unpacked on a USB stick, point it at the minidump folder and retrieve the BSOD history, along with the details. Save the results in a log file back to the attached USB stick and then do your research and plan your solution-attack. Sweet!
While this information would be very useful to a system admin or desktop support tech, it could also be of use to an forensic examiner as it might provide some clues on the system history or patterns of operating system issues or remnants.
Armed with the information obtained from the BlueScreenView utility, just drop in any any one of these awesome BSOD decoding websites (or Google) and you are good to start the solutioning.
- Troubleshooting Windows STOP Messages - James A. Eshelman
- Understanding and Decoding BSOD (blue screen of death) Messages - Taranfx: Technology Blog
- The ABC of Blue-Screen Dump Analysis - All Your Base Are Belong To Us
Miscellany
Not directly related but seemed better to post here then in the previous Microsoft Linkfest post.
- Two Minute Drill: Debugging – lm, not just Alphabet Neighbors – Ask the Performance Team blog
- Two Minute Drill: Debugging and the k* Commands – Ask the Performance Team blog
- Converting Perfmon timestamps to a readable format in Excel - the back room tech
Thank you Nir!
--Claus V.


No comments:
Post a Comment